

Monitoring & Tracing
A running ZeroFS server exposes a gRPC admin API. Four CLI commands consume it: zerofs monitor renders a live stats dashboard in the terminal, zerofs fatrace prints one line per filesystem operation, zerofs otrace prints one line per object-store request, and zerofs flush persists buffered writes to durable storage on demand. Any gRPC client can call the same API.
The RPC Server
All four commands connect to a zerofs run instance through the admin server configured under [servers.rpc]:
zerofs.toml
[servers.rpc]
addresses = ["127.0.0.1:7000"]
unix_socket = "/tmp/zerofs.rpc.sock"
addresses binds TCP listeners; unix_socket binds a Unix domain socket. Either or both can be set. The configuration generated by zerofs init enables both, with TCP on 127.0.0.1:7000 and the socket at /tmp/zerofs.rpc.sock.
Each command takes -c with the same configuration file and reads the connection details from it. The client tries the Unix socket first if the socket file exists, then each TCP address in turn. Without a [servers.rpc] section, the commands exit with RPC server not configured in config file.
zerofs monitor
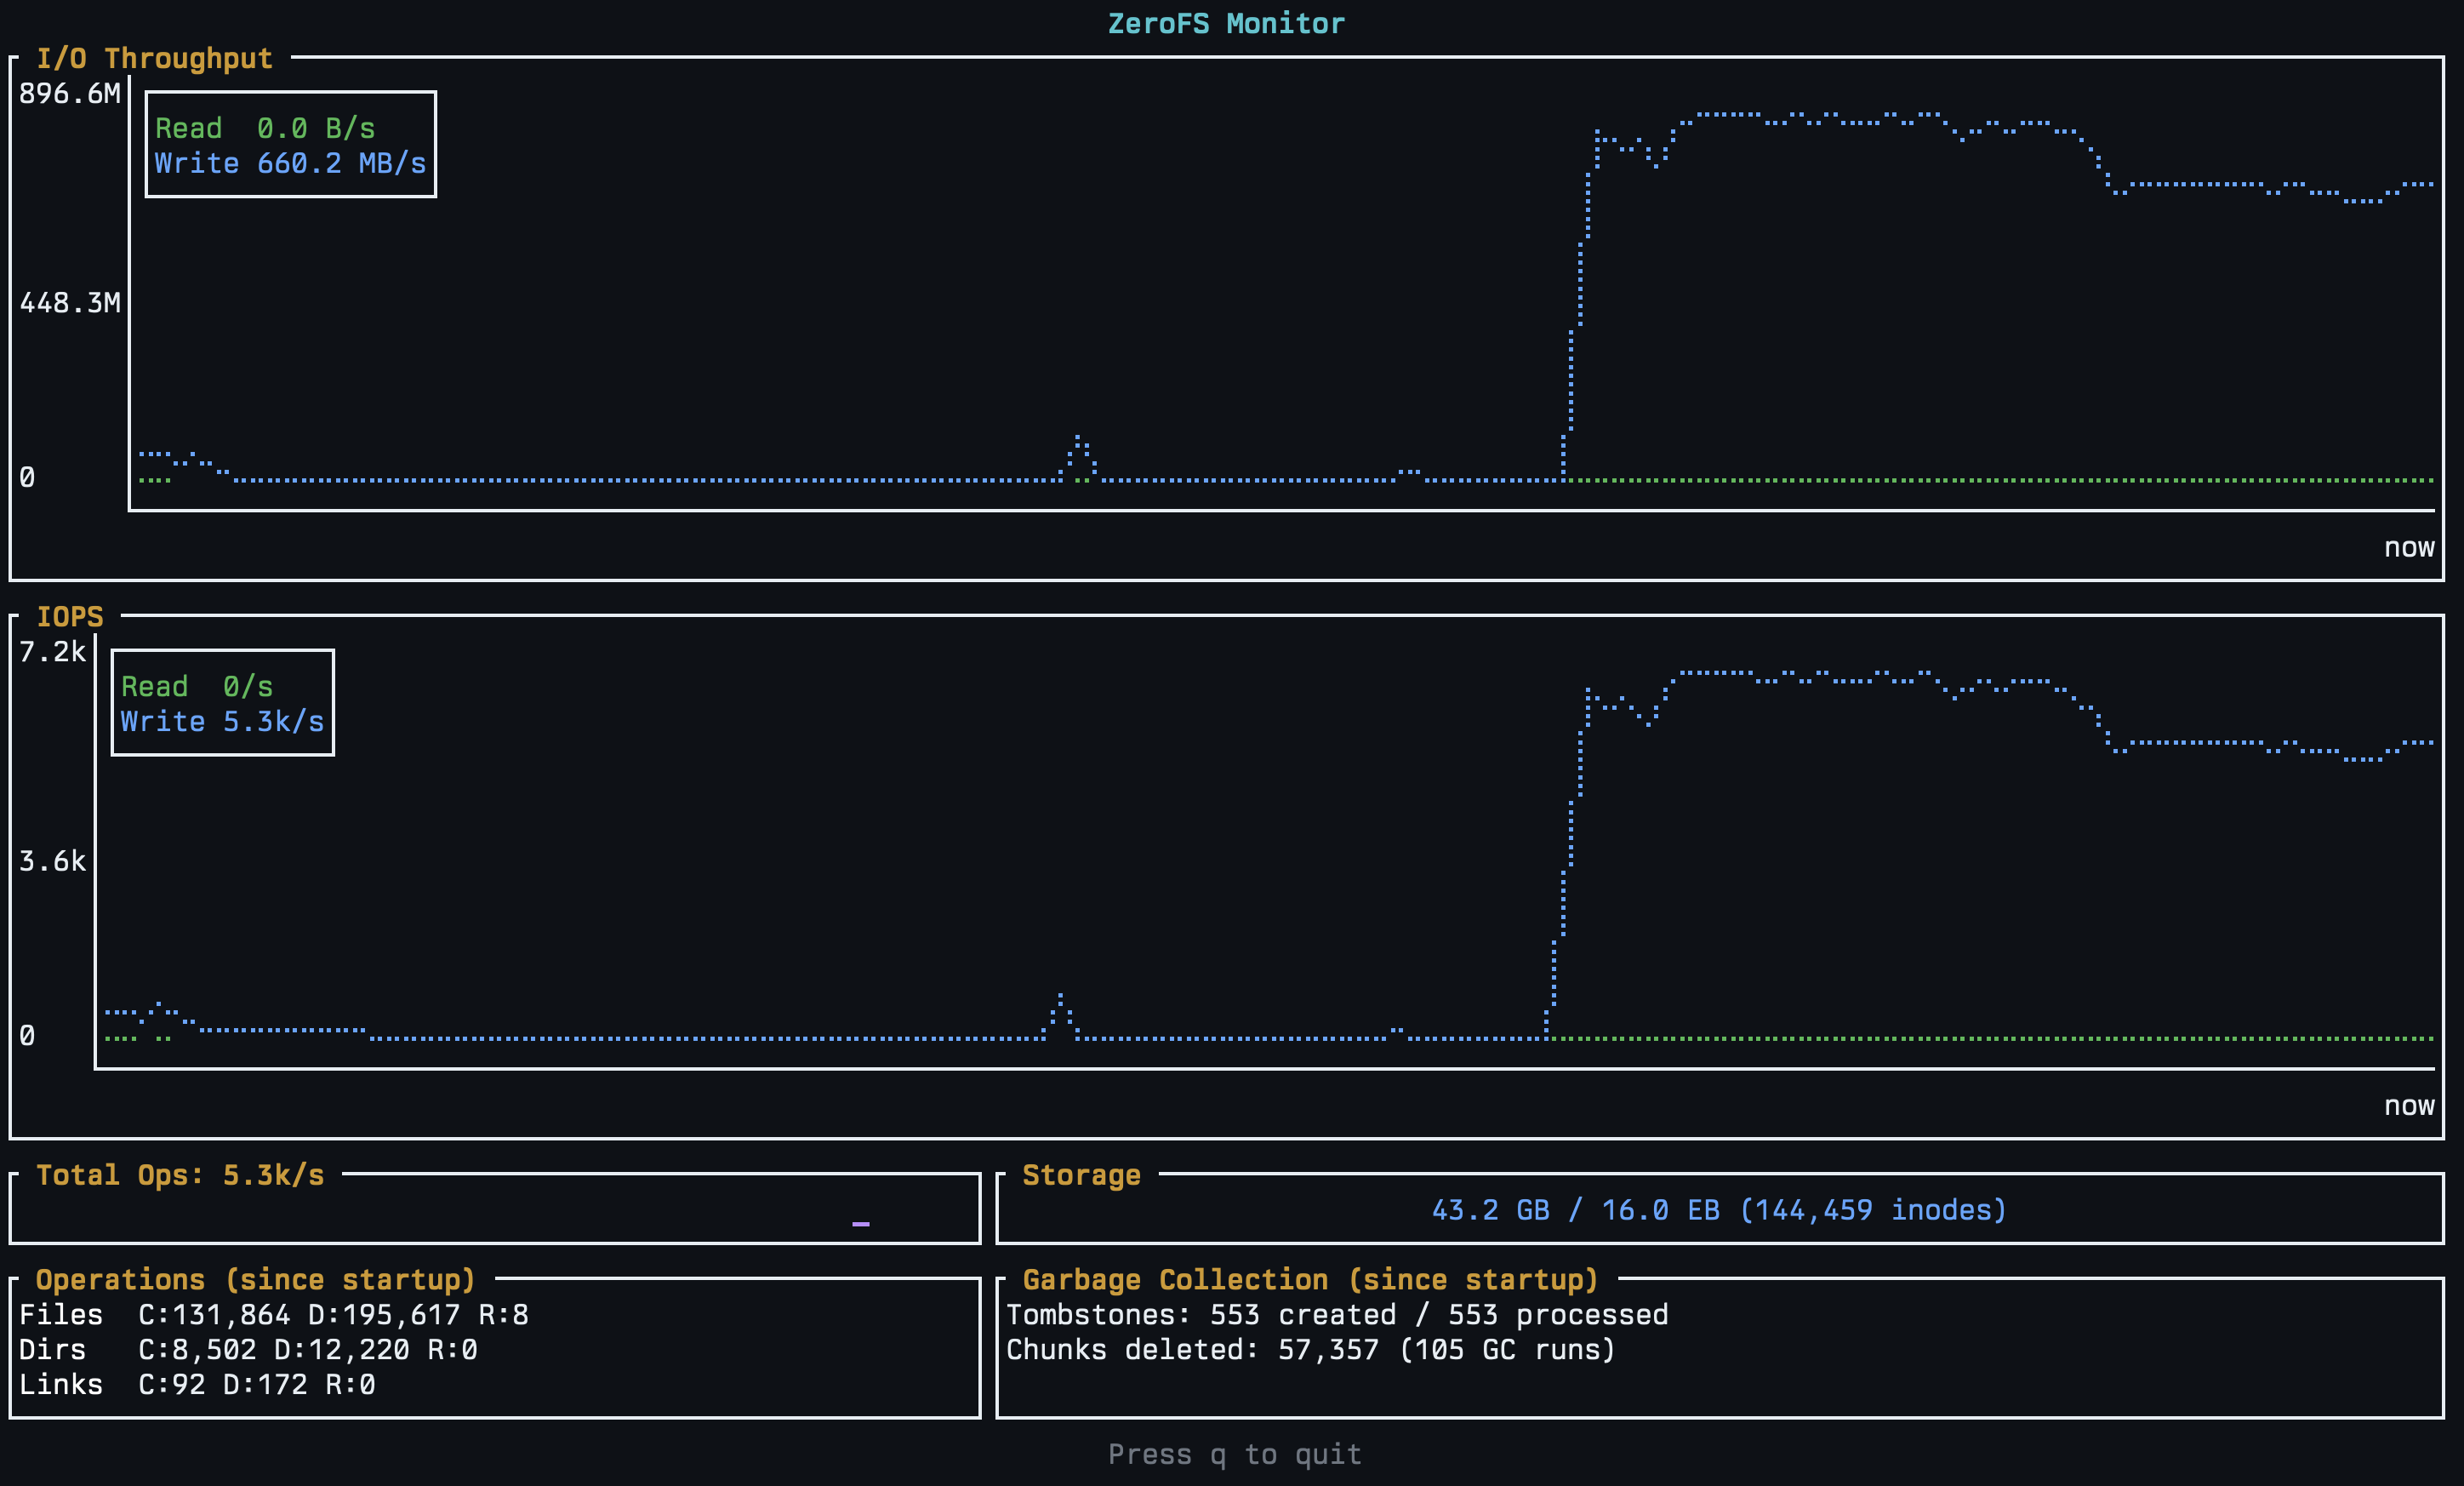
zerofs monitor opens a full-screen terminal dashboard fed by a stats stream from the server:
- I/O throughput and IOPS charts: separate read and write series; rates are computed over windows of one second or one refresh interval, whichever is longer, and the latest 120 samples are kept
- Total operations sparkline: operations per second across all operation types
- Storage gauge: used bytes against the configured capacity, plus the inode count
- Segment space: the extent segment store's footprint, as a bar and figures. Live data splits into the part durable on the object store and the part still buffered in RAM (unflushed), shown next to dead bytes, bytes in fully-dead segments being deleted, the segment count, and the reclaimable percentage. A status line reports the reclamation GC's cadence tier (base, drain, or fast), the reason for it, and what the last pass did or has queued
- Operation counters: files, directories, and links created, deleted, and renamed since server start
- Garbage collection counters: tombstones created and processed, extents deleted, and GC runs since server start
- jemalloc memory: allocated, resident, retained, and metadata bytes of the server process, plus a fragmentation percentage (resident minus allocated, relative to allocated)
Press q or Ctrl+C to quit.
Run the Dashboard
zerofs monitor -c zerofs.toml

# Refresh every second instead of
# the default 250 ms
zerofs monitor -c zerofs.toml --interval 1000
--interval sets the snapshot interval in milliseconds and defaults to 250. The server clamps intervals below 250 ms to 250 ms.
The Web UI dashboard streams the same stats snapshots over gRPC-web. For pull-based metrics, use the Prometheus endpoint.
zerofs fatrace
zerofs fatrace subscribes to the server's file access stream and prints one line per filesystem operation: the operation type, the resolved path, and the operation's parameters. 14 operation types are traced: read, write, create, remove, rename, mkdir, readdir, lookup, setattr, link, symlink, mknod, trim, and fsync.
Parameters depend on the operation:
| Operations | Extra fields |
|---|---|
| read, write, trim | offset= and len= in bytes |
| create, mkdir, setattr, mknod | mode= in octal |
| rename, link | -> destination path |
| symlink | -> link target |
| lookup | name= the looked-up filename |
Trace a Log Rotation
$ zerofs fatrace -c zerofs.toml
Tracing file access (Ctrl+C to stop)...
write   | /logs/app.log offset=53248 len=4096
fsync   | /logs/app.log
rename  | /logs/app.log -> /logs/app.log.1
create  | /logs/app.log mode=0644
lookup  | /logs/app.log.1 name=app.log.1
read    | /logs/app.log.1 offset=0 len=65536
Overhead
When no client is subscribed, the server checks the subscriber count and returns: path resolution and event dispatch are skipped entirely. With a subscriber attached, the server resolves paths and broadcasts events in background tasks, so the filesystem operation itself never waits on tracing.
Events pass through a broadcast channel that buffers 1,024 events. When a subscriber falls behind during a burst, the oldest buffered events are dropped from that subscriber's stream rather than slowing the filesystem. The trace is an observation tool, not a complete audit log.
zerofs otrace
Where zerofs fatrace traces filesystem operations, zerofs otrace traces the layer below: the requests ZeroFS actually sends to the object store. It subscribes to the server's object access stream and prints one line per backend request: the operation, the object key, request parameters, the request duration, and an ERR marker when the request failed.
The trace sits at the bottom of the storage stack, so it shows what leaves the process. File data appears as requests against immutable segment objects under segments/<shard>/<epoch>/<counter>. A segment seal (on flush, or when the open buffer reaches 256 MiB) uploads as a single put when it fits the writer's 10 MiB upload buffer; larger seals, including the 256 MiB background seal, stream as multipart and appear as mpart. Cold reads issue ranged gets of frame bytes; garbage collection issues footer and directory gets on the segments it inspects and a delete per dead segment, while a list of segments/ appears only from the daily orphan sweep. Metadata appears as LSM SST and manifest traffic, including metadata compaction. A write burst produces no lines at all: writes buffer in RAM and the upload shows up at the next seal. Reads served from the cache make no backend request and so produce no line; the trace is a faithful picture of object-store traffic, not of logical reads. Eight operations are traced: get, head, put, mpart (multipart upload), delete, list, copy, and rename.
| Operations | Extra fields |
|---|---|
| get | off= byte offset and len= length for ranged reads |
| put | size= payload size |
| copy, rename | -> destination key |
Trace Object-Store Traffic
$ zerofs otrace -c zerofs.toml
Tracing object store requests (Ctrl+C to stop)...
get    | .../manifest/00000000000000000010.manifest  118µs
mpart  | .../segments/2a/0000000000000007/000000000000012a  1.2ms
get    | .../segments/2a/0000000000000007/000000000000012a off=131072 len=128.0 KB  9.7ms
put    | .../compacted/01J9X...sst size=4.0 MB  21.4ms
list   | .../segments
get    | .../gc/manifest.boundary  240µs  ERR
delete | .../segments/09/0000000000000005/0000000000000009
Overhead
Like fatrace, the object tracer checks the subscriber count first: with no client attached, every wrapped call is a plain delegation to the inner store and emits nothing. With a subscriber attached, each request is broadcast inline, and request-shaped operations are timed; stream-shaped list and delete events carry no duration. There is no path to resolve, so no background task is spawned. Events share the same 1,024-event broadcast buffer semantics: a subscriber that falls behind drops its oldest buffered events rather than slowing the store.
zerofs flush
zerofs flush asks the running server to persist all buffered writes to durable storage. The command returns after the flush completes. The server coalesces concurrent flush requests into a single flush.
Between fsync calls, file data lives in the server's in-RAM open segment buffer and metadata in the memtable (see Durability & Consistency). A flush first seals the open segment and uploads it as an immutable segment object (a single PUT for small seals, streamed as one multipart upload for larger ones, up to 256 MiB), then flushes metadata. If the segment upload fails, the flush returns an error without flushing metadata, so metadata never becomes durable ahead of the data it points to.
The same flush runs automatically on every client fsync, every [lsm] flush_interval_secs (default 30 s), and at the start of each segment garbage-collection pass. zerofs flush creates a durability point on demand without requiring clients to call fsync, for example before stopping the server or before creating a checkpoint.
Flush
$ zerofs flush -c zerofs.toml
Flush completed successfully
Flush returns an error when the server runs read-only (zerofs run --read-only or --checkpoint), since a read-only instance has no pending writes to persist.
The gRPC AdminService
The four commands, along with the checkpoint commands, are clients of a single gRPC service: zerofs.admin.AdminService, defined in zerofs/proto/admin.proto. It exposes ten RPCs:
- Name
CreateCheckpoint- Type
- unary
- Description
Creates a named checkpoint; returns its name, UUID, and creation timestamp
- Name
ListCheckpoints- Type
- unary
- Description
Returns all checkpoints
- Name
DeleteCheckpoint- Type
- unary
- Description
Deletes a checkpoint by name
- Name
GetCheckpointInfo- Type
- unary
- Description
Returns one checkpoint by name; NOT_FOUND if it does not exist
- Name
Flush- Type
- unary
- Description
Persists buffered writes to durable storage; returns on completion
- Name
WatchFileAccess- Type
- server streaming
- Description
Streams one
FileAccessEventper filesystem operation (thezerofs fatracefeed)
- Name
WatchObjectAccess- Type
- server streaming
- Description
Streams one
ObjectAccessEventper object-store request (thezerofs otracefeed)
- Name
StreamStats- Type
- server streaming
- Description
Streams
StatsSnapshotmessages at the requestedinterval_ms, clamped to a 250 ms minimum (thezerofs monitorfeed)
- Name
CreateDirectory- Type
- unary
- Description
Creates a directory at an absolute path, creating missing parents (
mkdir -psemantics); returns whether this call created it
- Name
RemoveDirectory- Type
- unary
- Description
Removes a directory tree by path; idempotent, so a missing path is a success. The tree is moved aside and deleted in the background
The service answers on the configured TCP addresses and Unix socket. It does not register gRPC server reflection, so generic clients such as grpcurl need the proto file:
Stream Stats with grpcurl
# admin.proto lives at zerofs/proto/admin.proto in the ZeroFS repository
grpcurl -plaintext \
  -import-path zerofs/proto -proto admin.proto \
  -d '{"interval_ms": 1000}' \
  127.0.0.1:7000 zerofs.admin.AdminService/StreamStats
This prints one JSON StatsSnapshot per second: operation counters, bytes read and written, GC activity, used bytes and inodes against the configured maximum, jemalloc memory statistics, and a segment_gc message carrying the extent segment footprint (segment count, live, dead, and unflushed bytes) and reclamation-GC status. For consumers that read StatsSnapshot by field name, the GC deletion counter is gc_extents_deleted (field 17, formerly gc_chunks_deleted).